State Data
Confidence in data for this state:
MODERATE
2018 data unless noted.
Definitions
Terms used on this website and in data sets are defined & discussed here.
Lagoon cleaning. Photo courtesy of H&A Resource Management.
Liquid biosolids land application. Photo courtesy of H&A Resource Management.
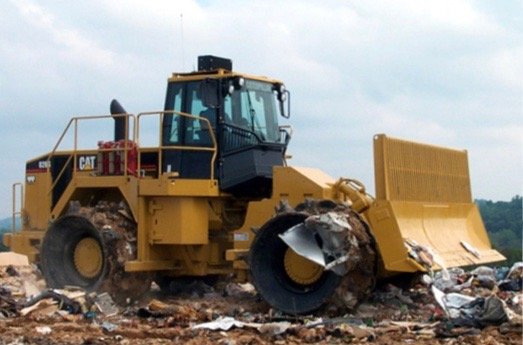
Most Kentucky wastewater solids go to landfills. Photo courtesy of City of Glasgow, KY.
State Statistics Dashboard
State Summary
● Louisville, the largest city, makes a notable Class A EQ heat-dried fertilizer product – Louisville Green. But that is one of only a few biosolids beneficial use programs in the Bluegrass State. Lexington, the second largest city, and a majority of other communities, dispose of wastewater solids in landfills, which have offered relatively low tipping fees for many years.
● The management – especially the land application – of Kentucky wastewater solids is overseen by the state Energy and Environment Cabinet (EEC), which relies on regulations established in 1992. Those antiquated regulations make beneficial use of Class B biosolids challenging.
● In 2021, as landfill tipping fees for “sludges” increase significantly, and with the regulatory pressure on Class B “landfarming” (as land application is called), several KY biosolids programs are looking at Class A EQ options. However, they find the costs involved to be daunting.
Biosolids land application (injection). Photo courtesy of H&A Resource Management.


