State Data
Confidence in data for this state:
HIGH
2018 data unless noted.
Definitions
Terms used on this website and in data sets are defined & discussed here.
Sand Island digester, Honolulu. Photo courtesy of Synagro.
State Statistics Dashboard
State Summary
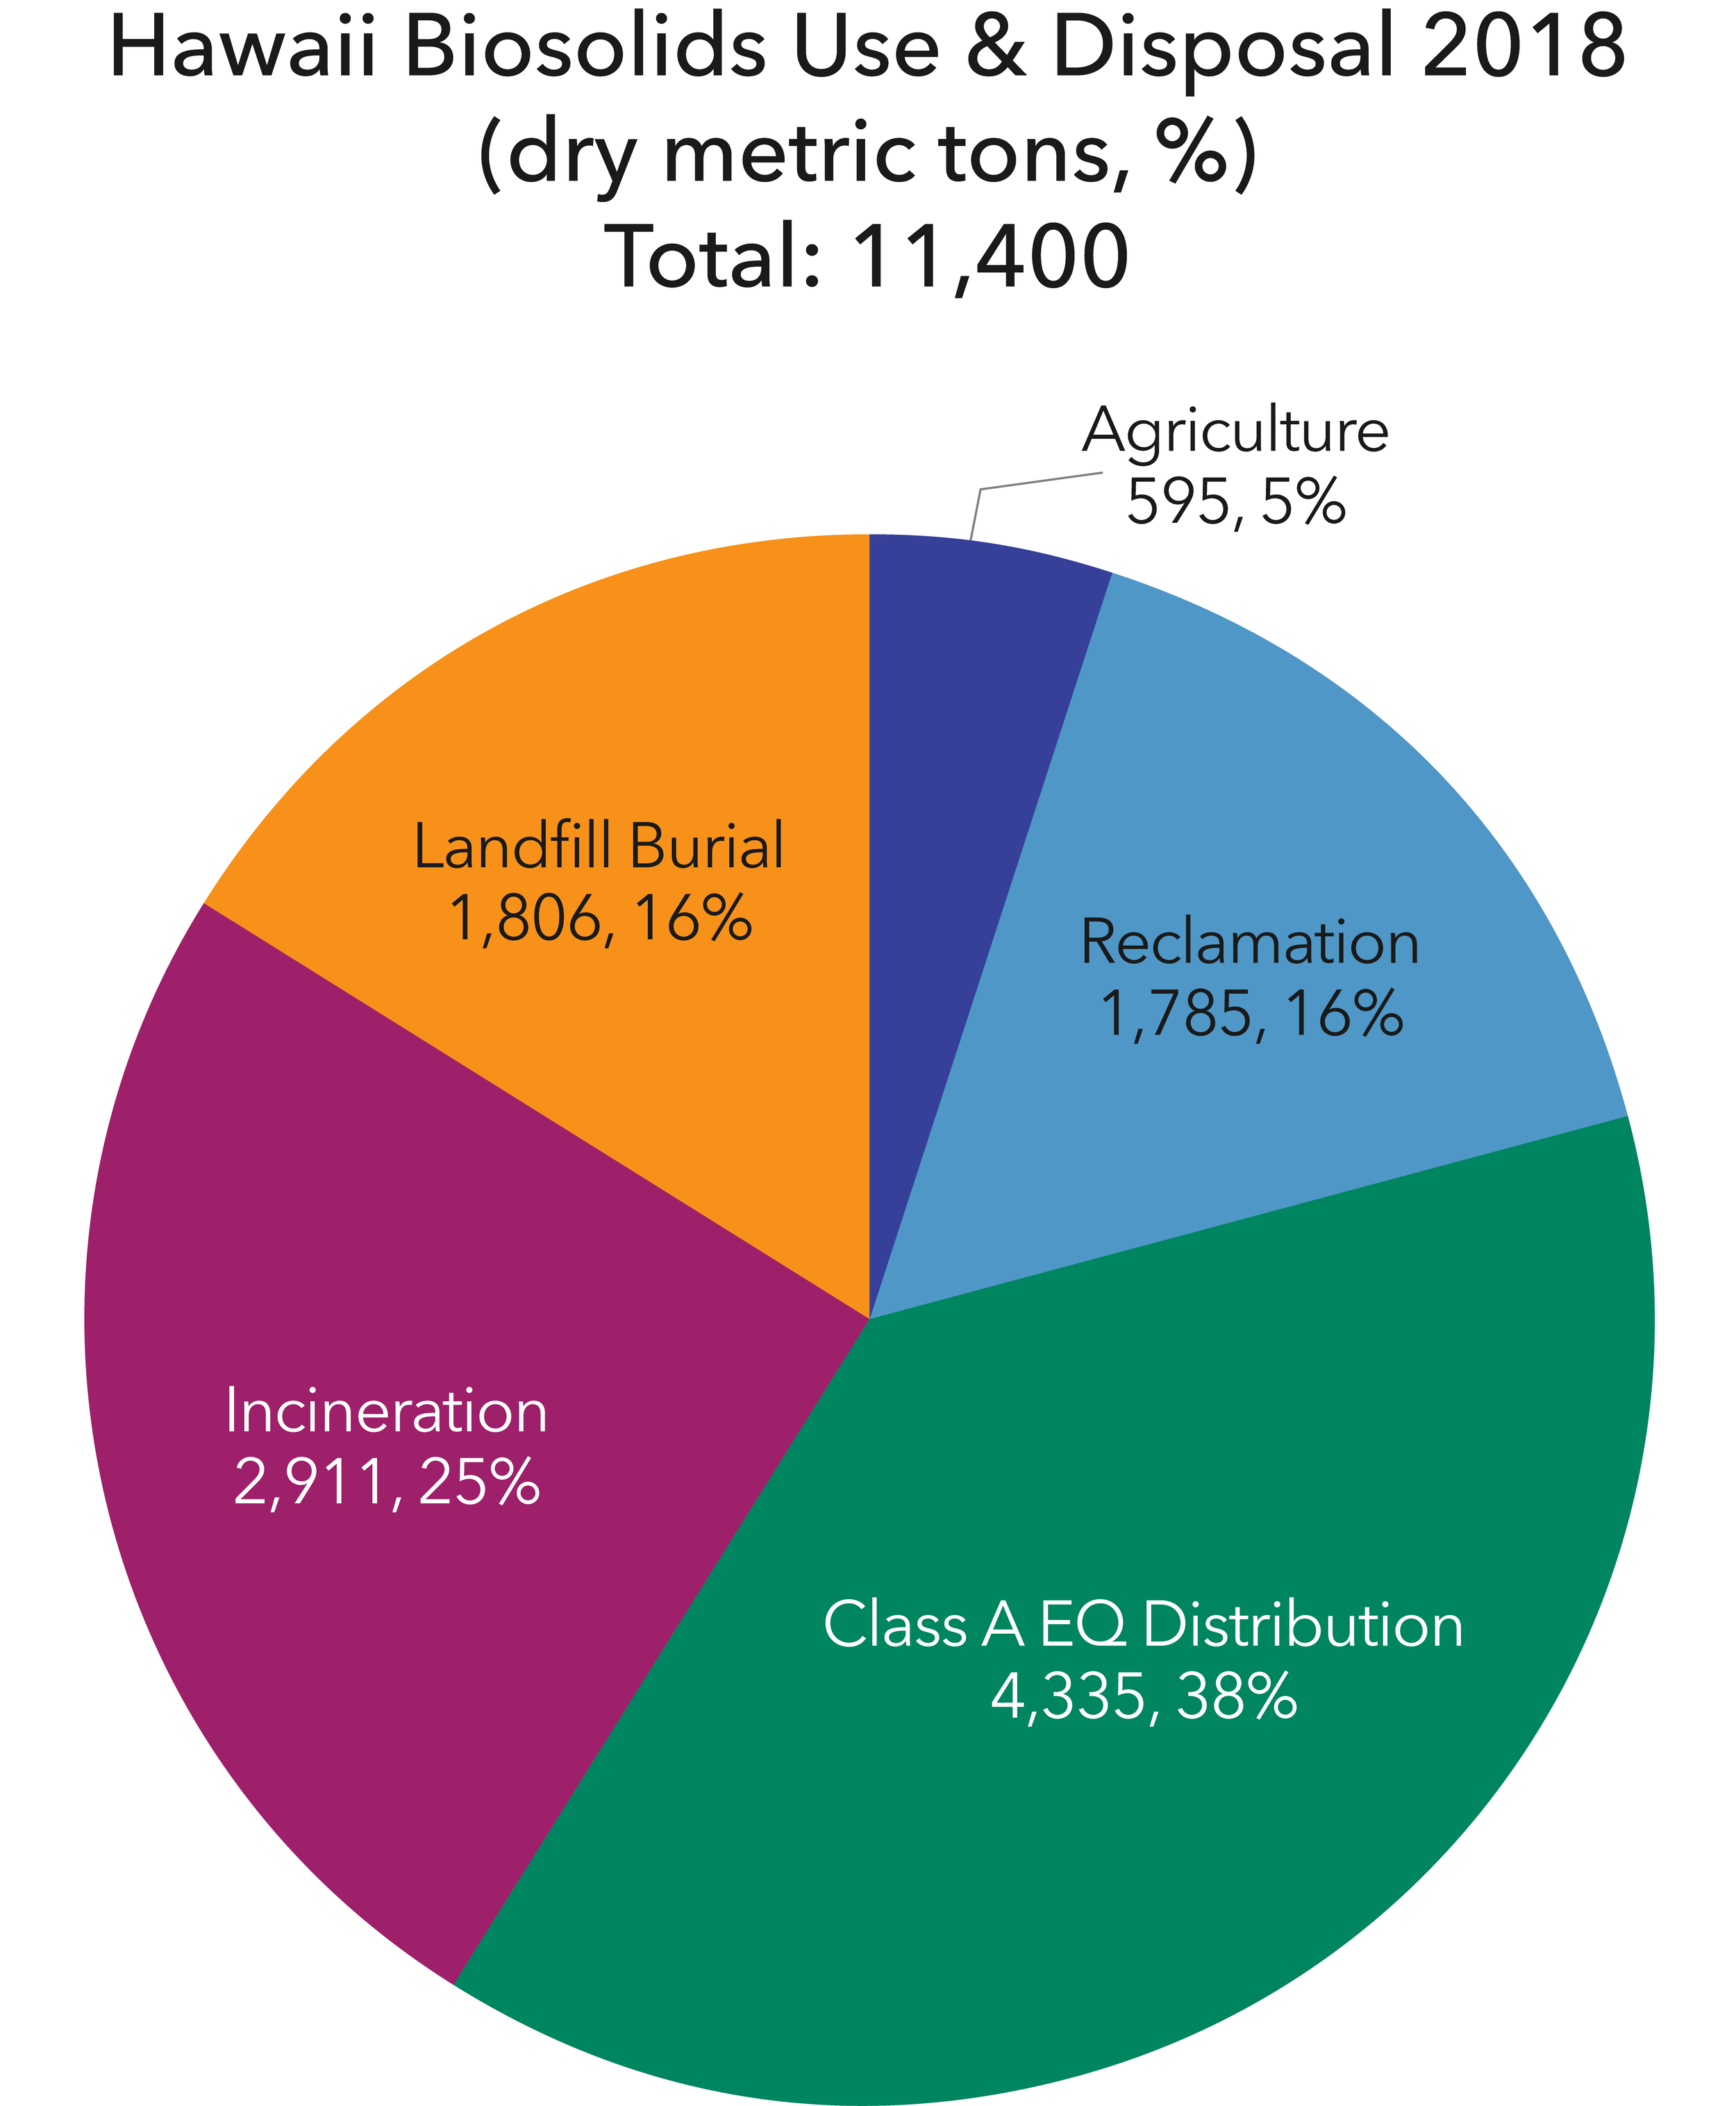
● Space and arable land are limited. Bulk land application is challenging; there is no Class B land application. Most biosolids – 52% – are treated to Class A EQ standards, of which, in 2018, about 60% were used for landscaping, horticulture, and home gardens; 30% for reclamation of abandoned sugar plantation land; and 10% for agriculture.
● In 2018, about one quarter of HI biosolids went to incineration at the H-POWER energy recovery facility on Oahu.
● Honolulu biosolids are treated at a new heat-drying facility operated by Synagro, producing Class A EQ pellets distributed for general use. In 2018, two compost facilities produced additional Class A EQ biosolids, but one – EKO compost on Maui – has since closed.
● By 2021, less biosolids was being recycled to soils. More is now going to landfills.


