State Data
Confidence in data for this state:
MODERATELY HIGH
2018 data unless noted.
Definitions
Terms used on this website and in data sets are defined & discussed here.
State Summary
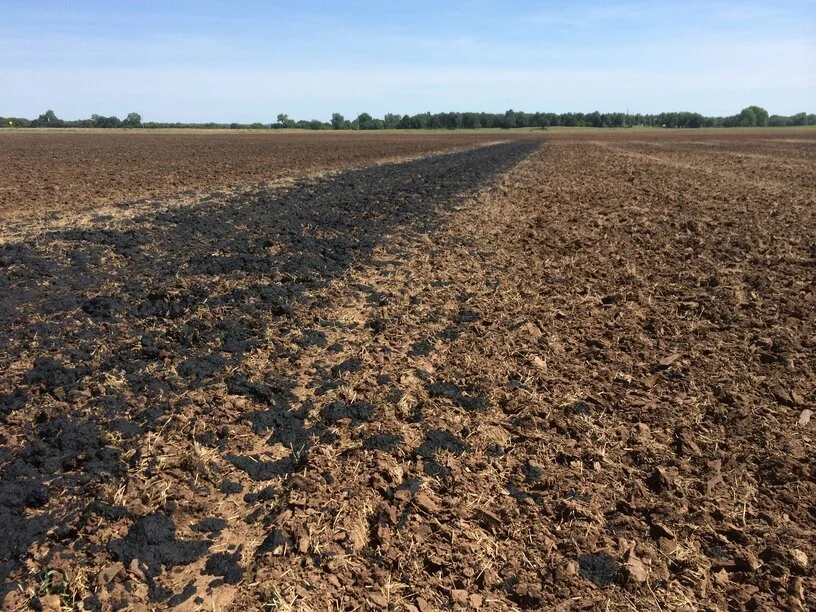
● Because of the state’s abundant ranching and farming, with high demand for fertilizers and soil amendments, Oklahoma’s biosolids management is dominated by land application of bulk, Class B biosolids.
● Biosolids land application in Oklahoma is relatively low cost - in the $25/wet ton range - compared to most solids management programs around the U.S.
● Oklahoma City produces half of the solids in the state, and its large Class B land application program faces some challenges with malodors and public acceptance.
Oklahoma City biosolids: from belt filter press —> soil —> hay crop… NEBRA photos


