State Data
Confidence in data for this state:
HIGH
2018 data unless noted.
Click chart to download.
Click chart to download.
Definitions
Terms used on this website and in data sets are defined & discussed here.
Missoula’s Wastewater Treatment Plant and Garden City Compost facility. Photo courtesy of Missoula Wastewater Division.
State Statistics Dashboard
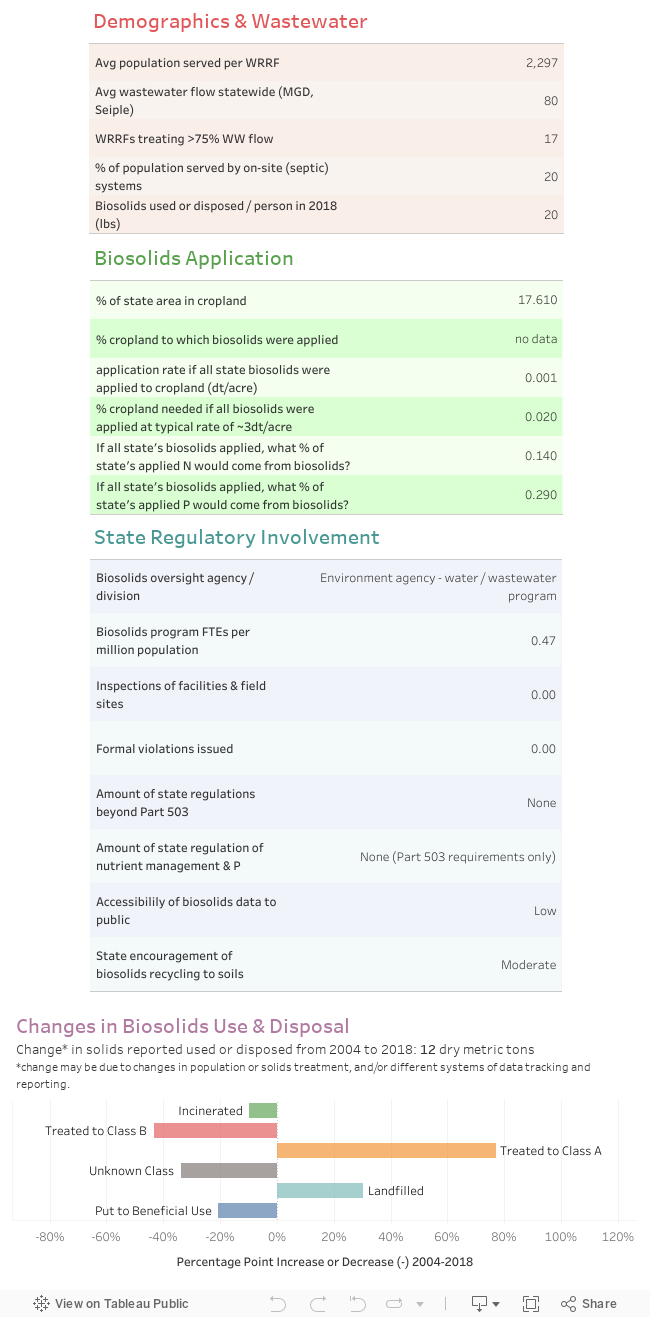

State Summary
● In 2018, a total of 10,700 dry metric tons (dmt) of biosolids were tracked, with 46% land applied and 54% going to landfills. An estimated few hundred additional dmt went to landfill or land application from small mechanical plants and one-time lagoon clean-out operations that were not required to report, resulting in a rounded estimate of 11,000 dmt for that year.
● Three larger communities account for most of the landfilled solids: Billings, Bozeman, and Great Falls.
● Several biosolids composting operations have been successful over many years, including Missoula’s Garden City Compost, the Glacier Gold Compost in the Kalispell and Whitefish area, and compost created from Butte-Silver Bow solids.

Anaerobic digestion & combined heat & power (CHP) at Missoula’s Wastewater Treatment Plant. Photo courtesy of Missoula Wastewater Division.